List of Useful Terms
For future reference

This post does not contain much in the way of argument or evidence. It’s a glossary of terms I find myself using regularly but that aren’t commonly used. I may or may not add to it late.
Graph Patterns
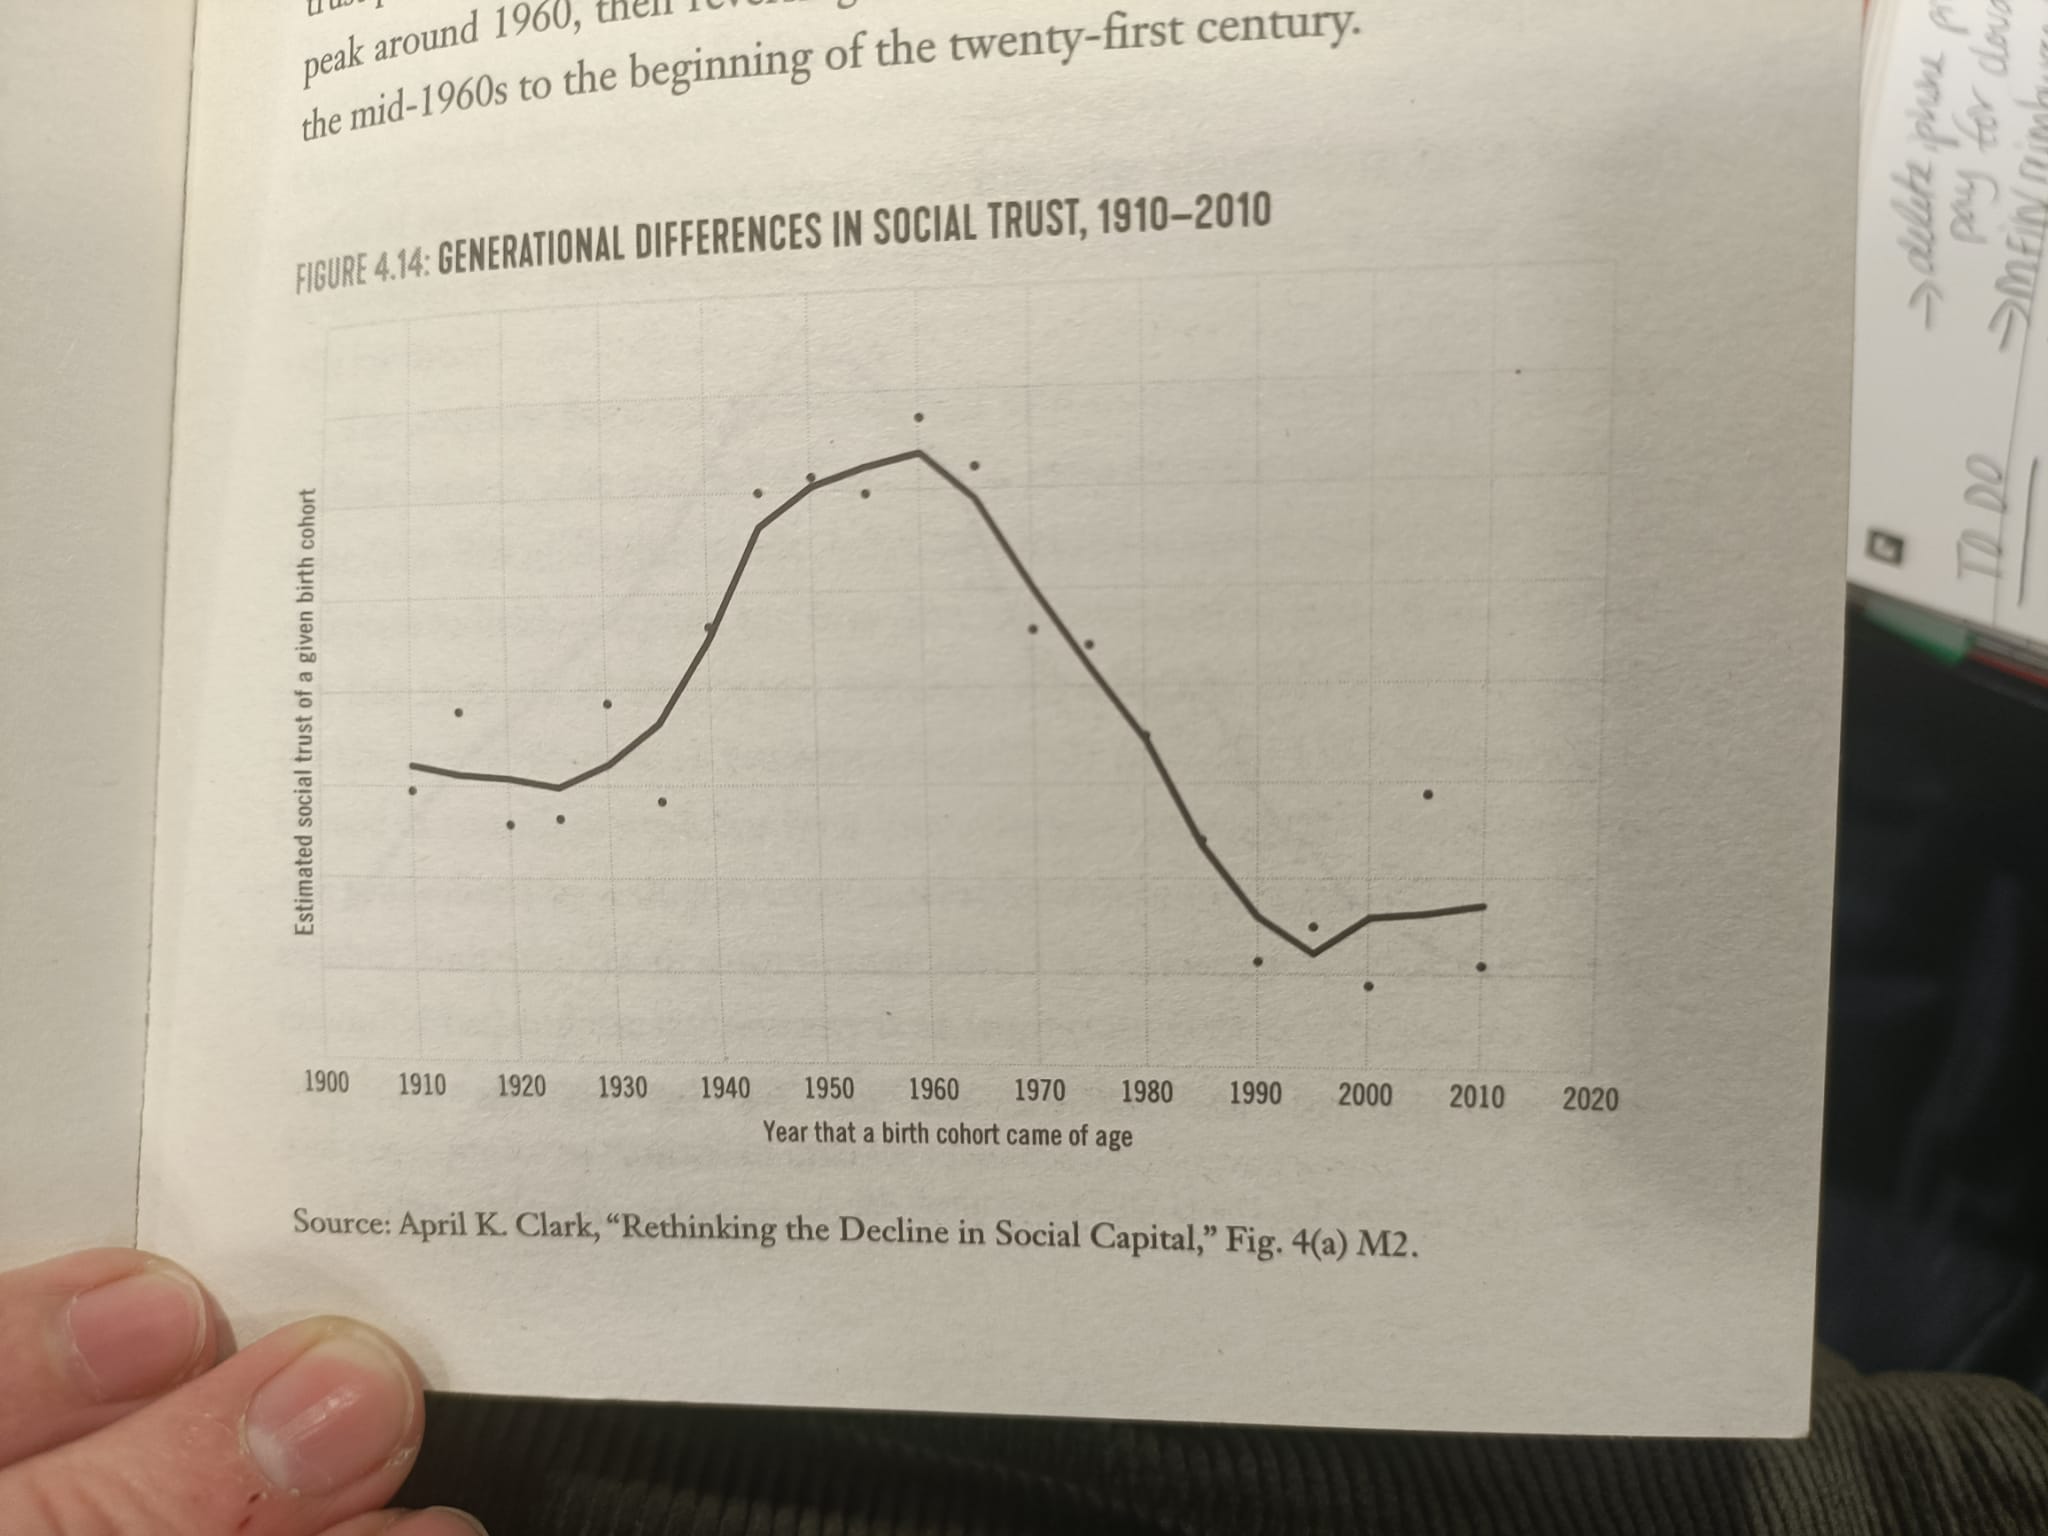
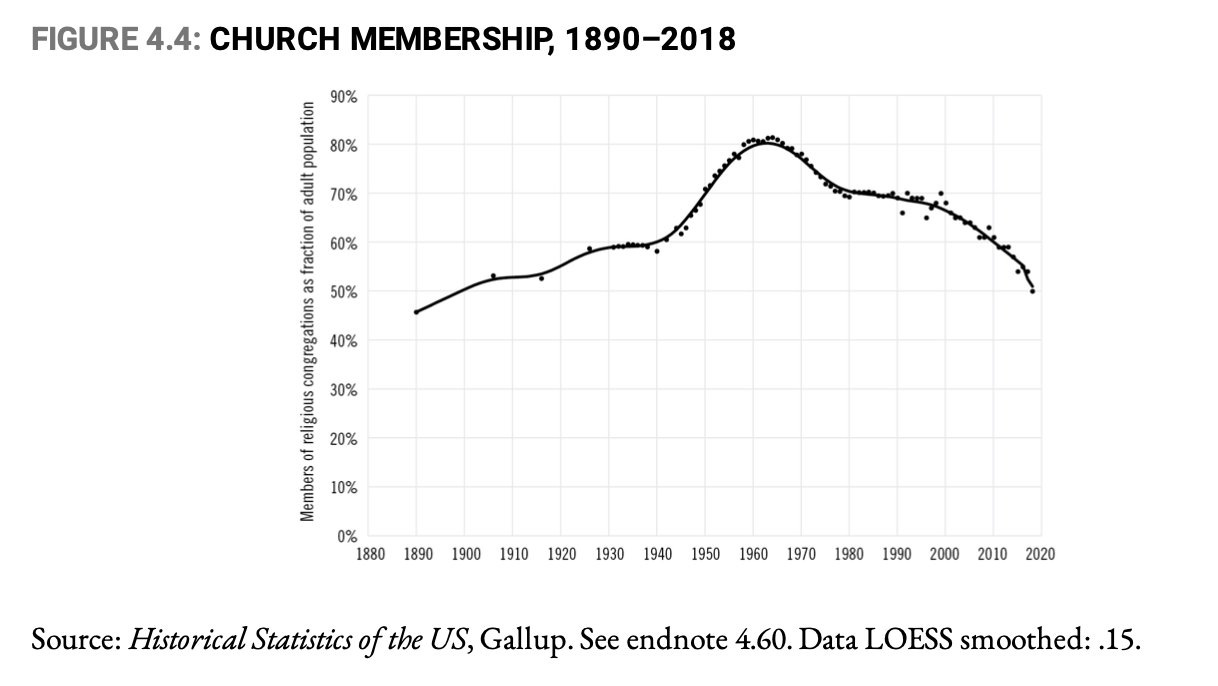
Baby Boom Pattern
The Baby Boom Pattern is a common pattern in social sciences charts in which some metric is declining at the start of the 20th century, reverses and peaks in the mid-century, before declining again around 1970. Robert Putnam’s term The Upswing is very similar.
Examples: social trust and church attendance in the United States, foreign-born share of the population in the United States, earned-income inequality in the United States, fertility, age of marriage, and childlessness in the United States and every other Western country, male:female wages and education ratios.

There are a few different causes; in the US, immigration restriction (1924-65) is a big factor, as is the postwar economic boom. I attribute the start of the marriage and fertility trend to the rising relative status (which can be seen in both wages and education) of young men vs their female counterparts. However, the end of this trend is because of legal and social changes to the basis of marriage. These are two distinct phenomena and should be conceptually separated.
Industrial Revolution Pattern
This is a graph pattern where humanity muddles along at some low level in some metric for millennia, before suddenly exploding with the Industrial Revolution and continuing to increase to this day. Some examples: life expectancy, world population, world GDP and GDP per capita, energy usage, agricultural yields.

The fact that so many important things have improved so much since the Industrial Revolution, and have continued to improve almost continuously since then, is sometimes used to justify everything about the present social and political status quo (often framed as owning the reactionaries or owning the trads), but that’s silly.
Everything Breaks in 1971 (or 1973)
This is a pattern where things are more or less constant (usually improving) until a sudden break for the worse around 1971. I attribute this pattern to the cultural revolution referred to as “the 60s,” which took place approximately between 1963 and 1973, which saw the triumph of second wave feminism, huge expansions of the welfare and regulatory states, Civil Rights and consequent racial privileges (affirmative action), enormous nonwhite immigration to the US for the first time, and environmentalism. The 1973 oil shock is symbolically the beginning of this period, but unlike much larger previous shocks (such as WWII) there was no return to trend because the social basis of progress was undermined.


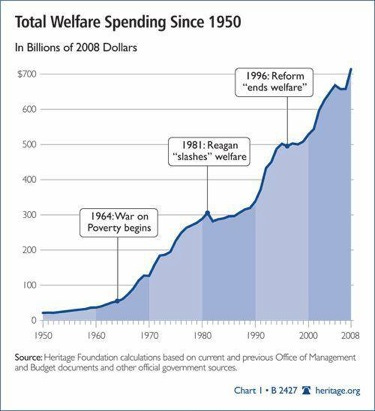
Examples: fraction of world GDP devoted to energy, world population growth rates, the Great Stagnation, the Henry Adams Curve). See also: WTFHappenedIn1971.
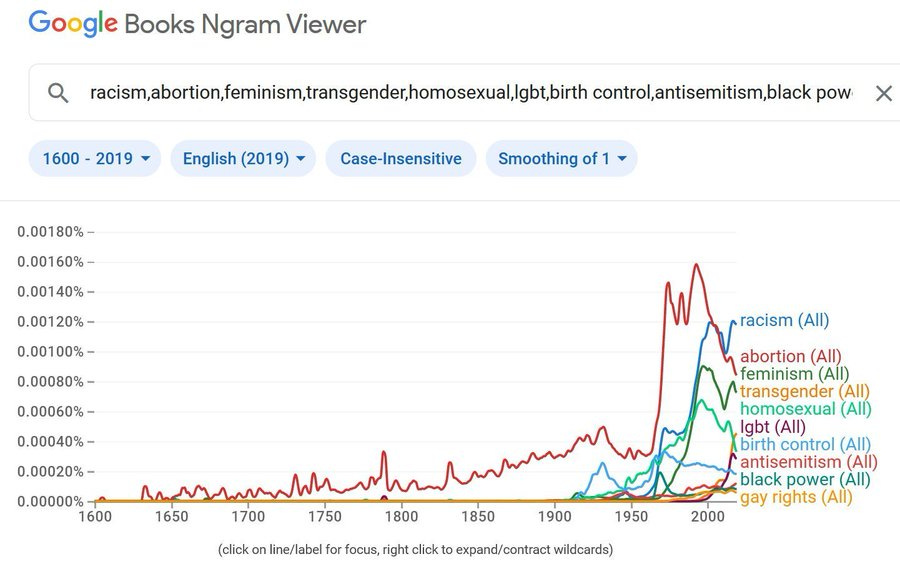
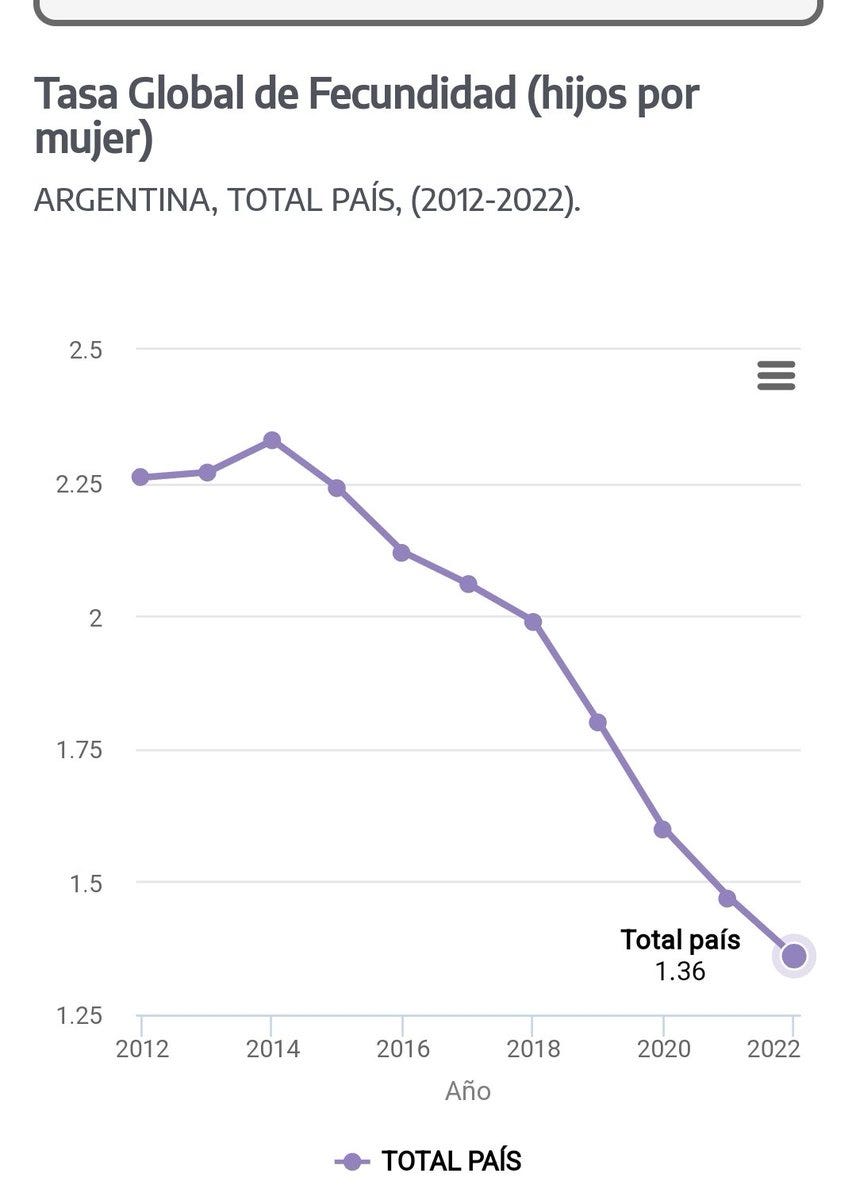
Great Awokening/Smartphones Pattern
This is a social sciences graph pattern where things seem to “break” around 2012. The proximate cause appears to be the rise of smartphones and social media, which not only greatly increase connectivity, but also increase the opportunity cost of doing anything else (since free, frictionless entertainment is always available).
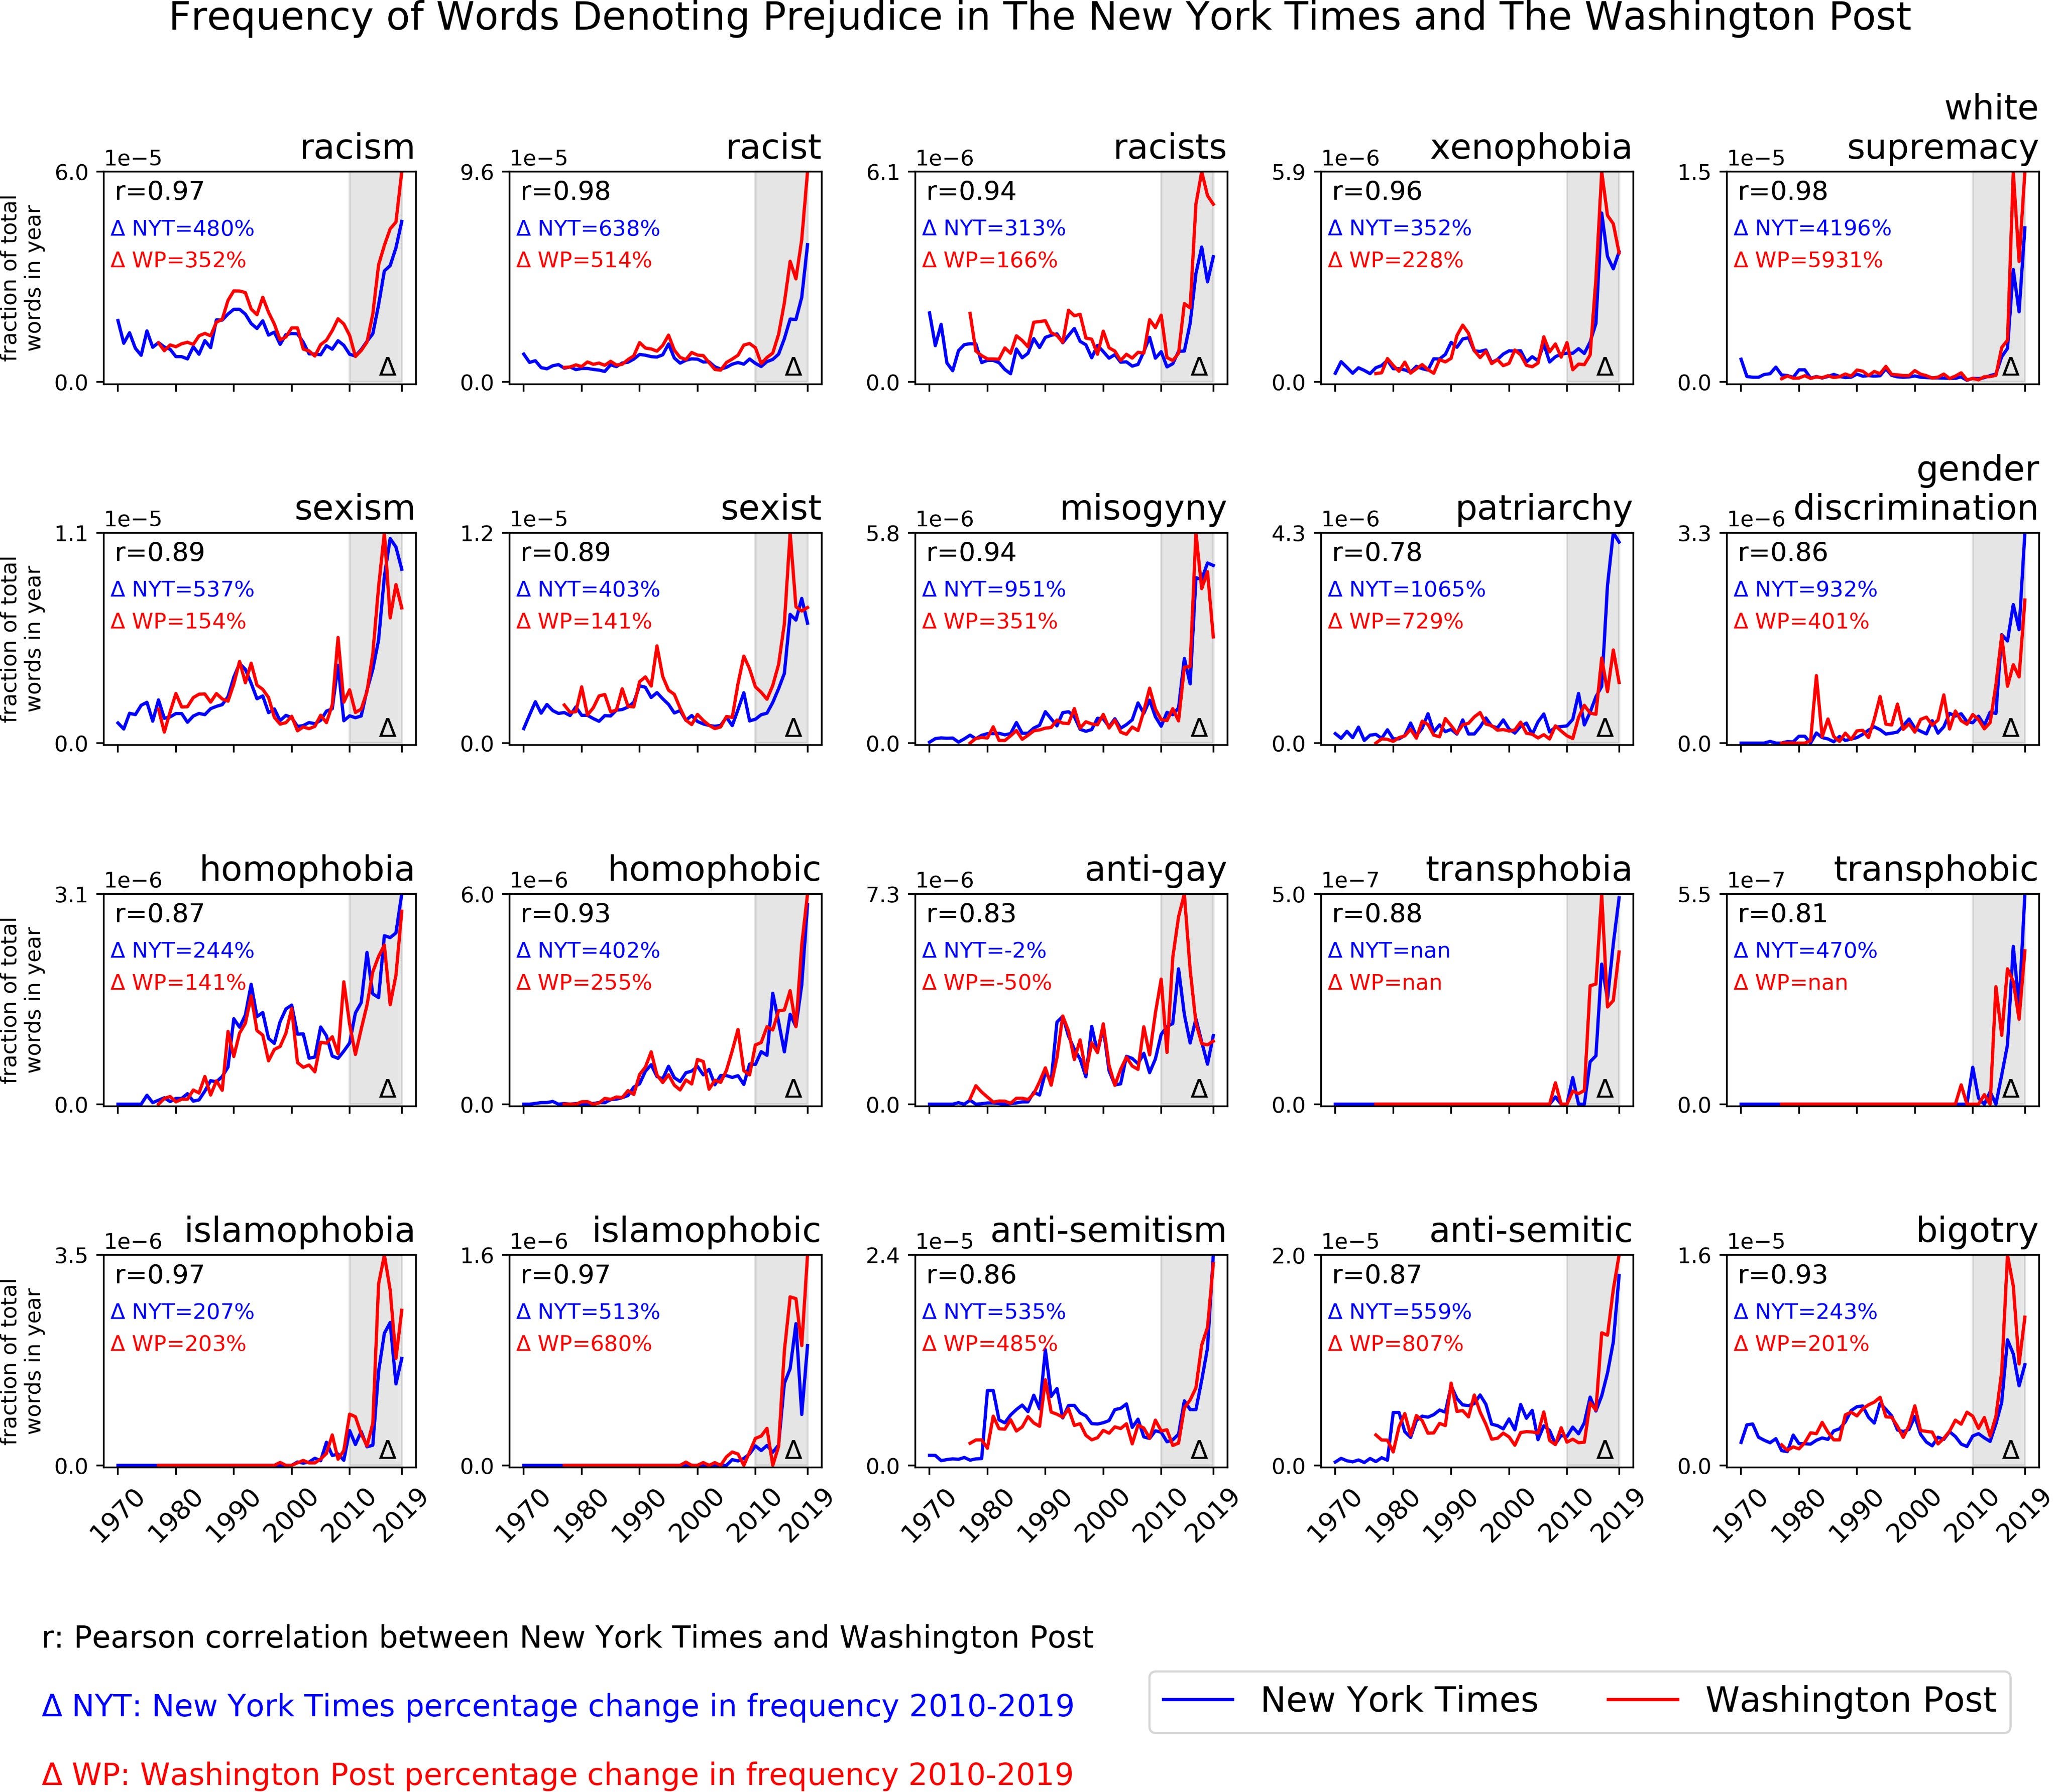

Examples: Extremely rapid Third World fertility collapse, especially Latin America, since 2012, and noticeable fertility decline in the First World, concentrated in the unmarried, low earners, young mothers, and racial minorities. Also the Great Awokening itself. I don’t believe wokeness is especially mysterious at all; all of the ideas contained within it were already present in the New Left and mostly institutionalized in the 60s. The difference was tone and intensity, plausibly explained by social media signaling spirals, which made publicly pledging allegiance to what was already official ideology something that could be expected from individuals and institutions (I also think feminization of institutions was partly responsible for the hysterical tone of the Great Awokening vs political correctness or the 60s, but that’s a continuous change, not a sharp break like smartphones).
Marriage
JD Unwin’s Marriage Taxonomy (Absolute vs Modified, Polygamy vs Monogamy)
English anthropologist JD Unwin classified marriage according to two axes: polygamy vs monogamy and absolute vs modified. Polygamy means multiple wives, monogamy one wife, absolute means it’s difficult to break up a marriage, modified means it’s easy. As with any social sciences classification these can be subdivided and qualified further, but they’re a good starting point for thinking about the incentives and effects of different types of marriage. As a rule, monogamy encourages intrasexual cooperation and absolute aligns long-term incentives around childrearing with short-term sexual incentives. See more here.
Hajnal Line/Northwest European Exceptionalism/Western European Marriage Pattern

The Hajnal Line was discovered by demographer John Hajnal, who noticed that women within this line tended to marry later and have much higher frequencies of spinsterhood, and that nuclear families (vs extended households) were relatively more important inside than outside the line. Of course, as with most social science categories, the line is more of a gradient than a sharp division and there are exceptions on both sides of the line.
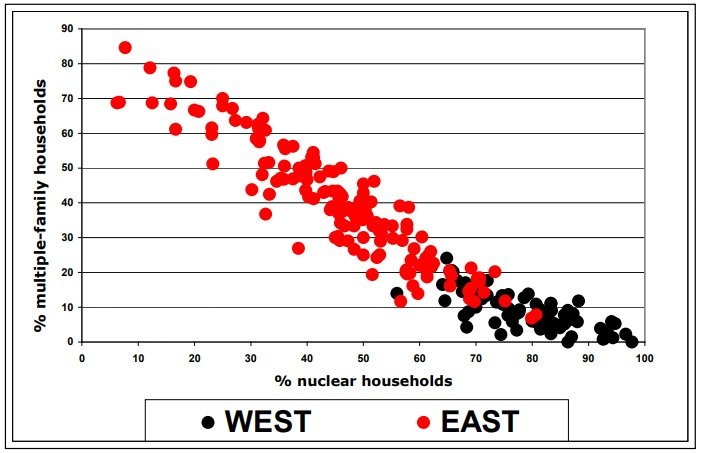
The key observation is that nations from within the line have been massively, world-historically successful in modernity, far beyond the level that would be expected from IQ, or other easily-measurable psychometric variables, alone.
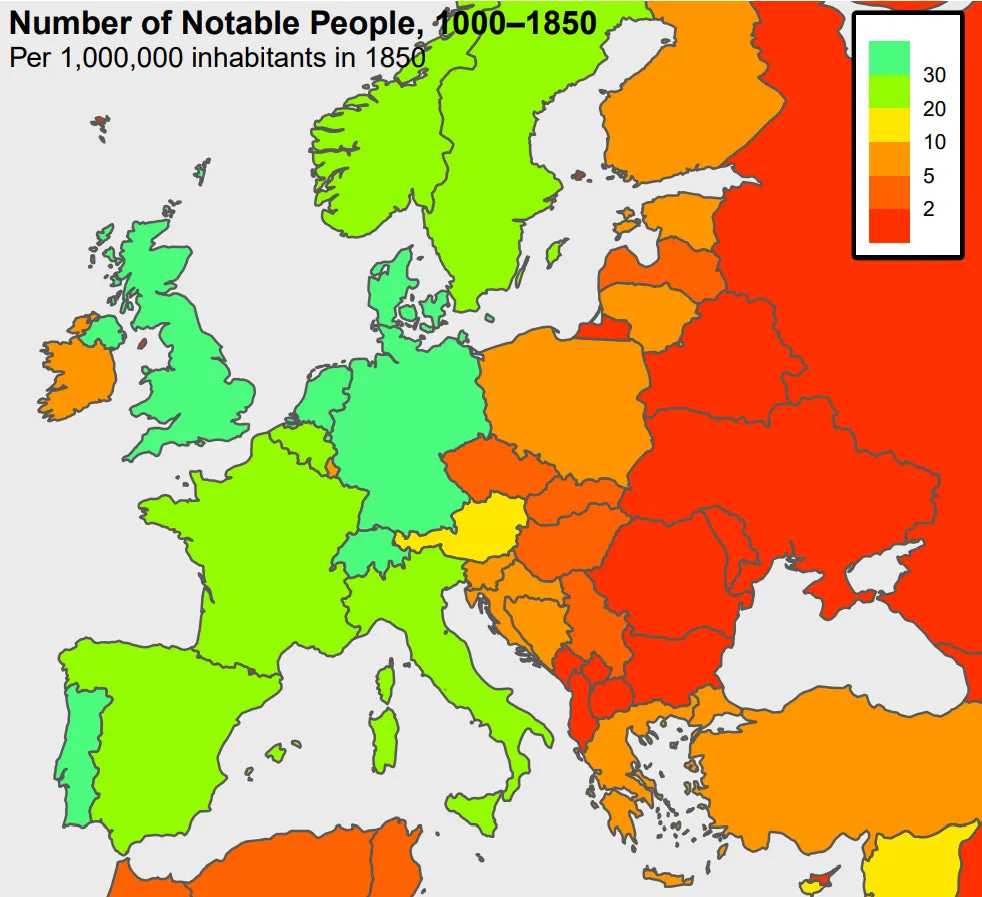
Crucially, it is as nations that they’ve been so successful. Highly capable individuals (such as Nikola Tesla) and even populations (such as Ashkenazi Jews) from outside the line do just fine as immigrants operating within a larger society created by Hajnals, but struggle to build such societies themselves. I (and Joseph Henrich, though with some differences in the details) attribute this to the Western European Marriage Pattern (absolute monogamy, love marriages, neolocality, and hence later age of first marriage) encouraging impersonal cooperation and formal institutions rather than kin networks as the basis of society, though there are other explanations.
Coffee Salon Demographics
This idea comes from Anatoly Karlin, who observed that ideas-focused groups tend to be very disproportionately (~90%) male and white, especially conditional on IQ, with women and Asians severely underrepresented. My personal hypothesis is that this “ideas-orientation” explains why pre-20th century Chinese philosophy, science, theology, and math were so poorly developed relative to even their classical Greek counterparts, much less post-Scientific Revolution Western Europe. The Chinese did not even know the Earth was roughly spherical until the Jesuits told them in the 16th century, while Eratosthenes calculated the circumference of the Earth to within 1% in 240 BC. This despite the fact that for most of history China was the most administratively, technologically, and economically advanced civilization on Earth, capable of incredible megaprojects such as the Grand Canal and the massive iron foundries of the Song Dynasty, with an intelligent, dense, literate (by pre-modern standards), and urban population.
The East Asian Exception
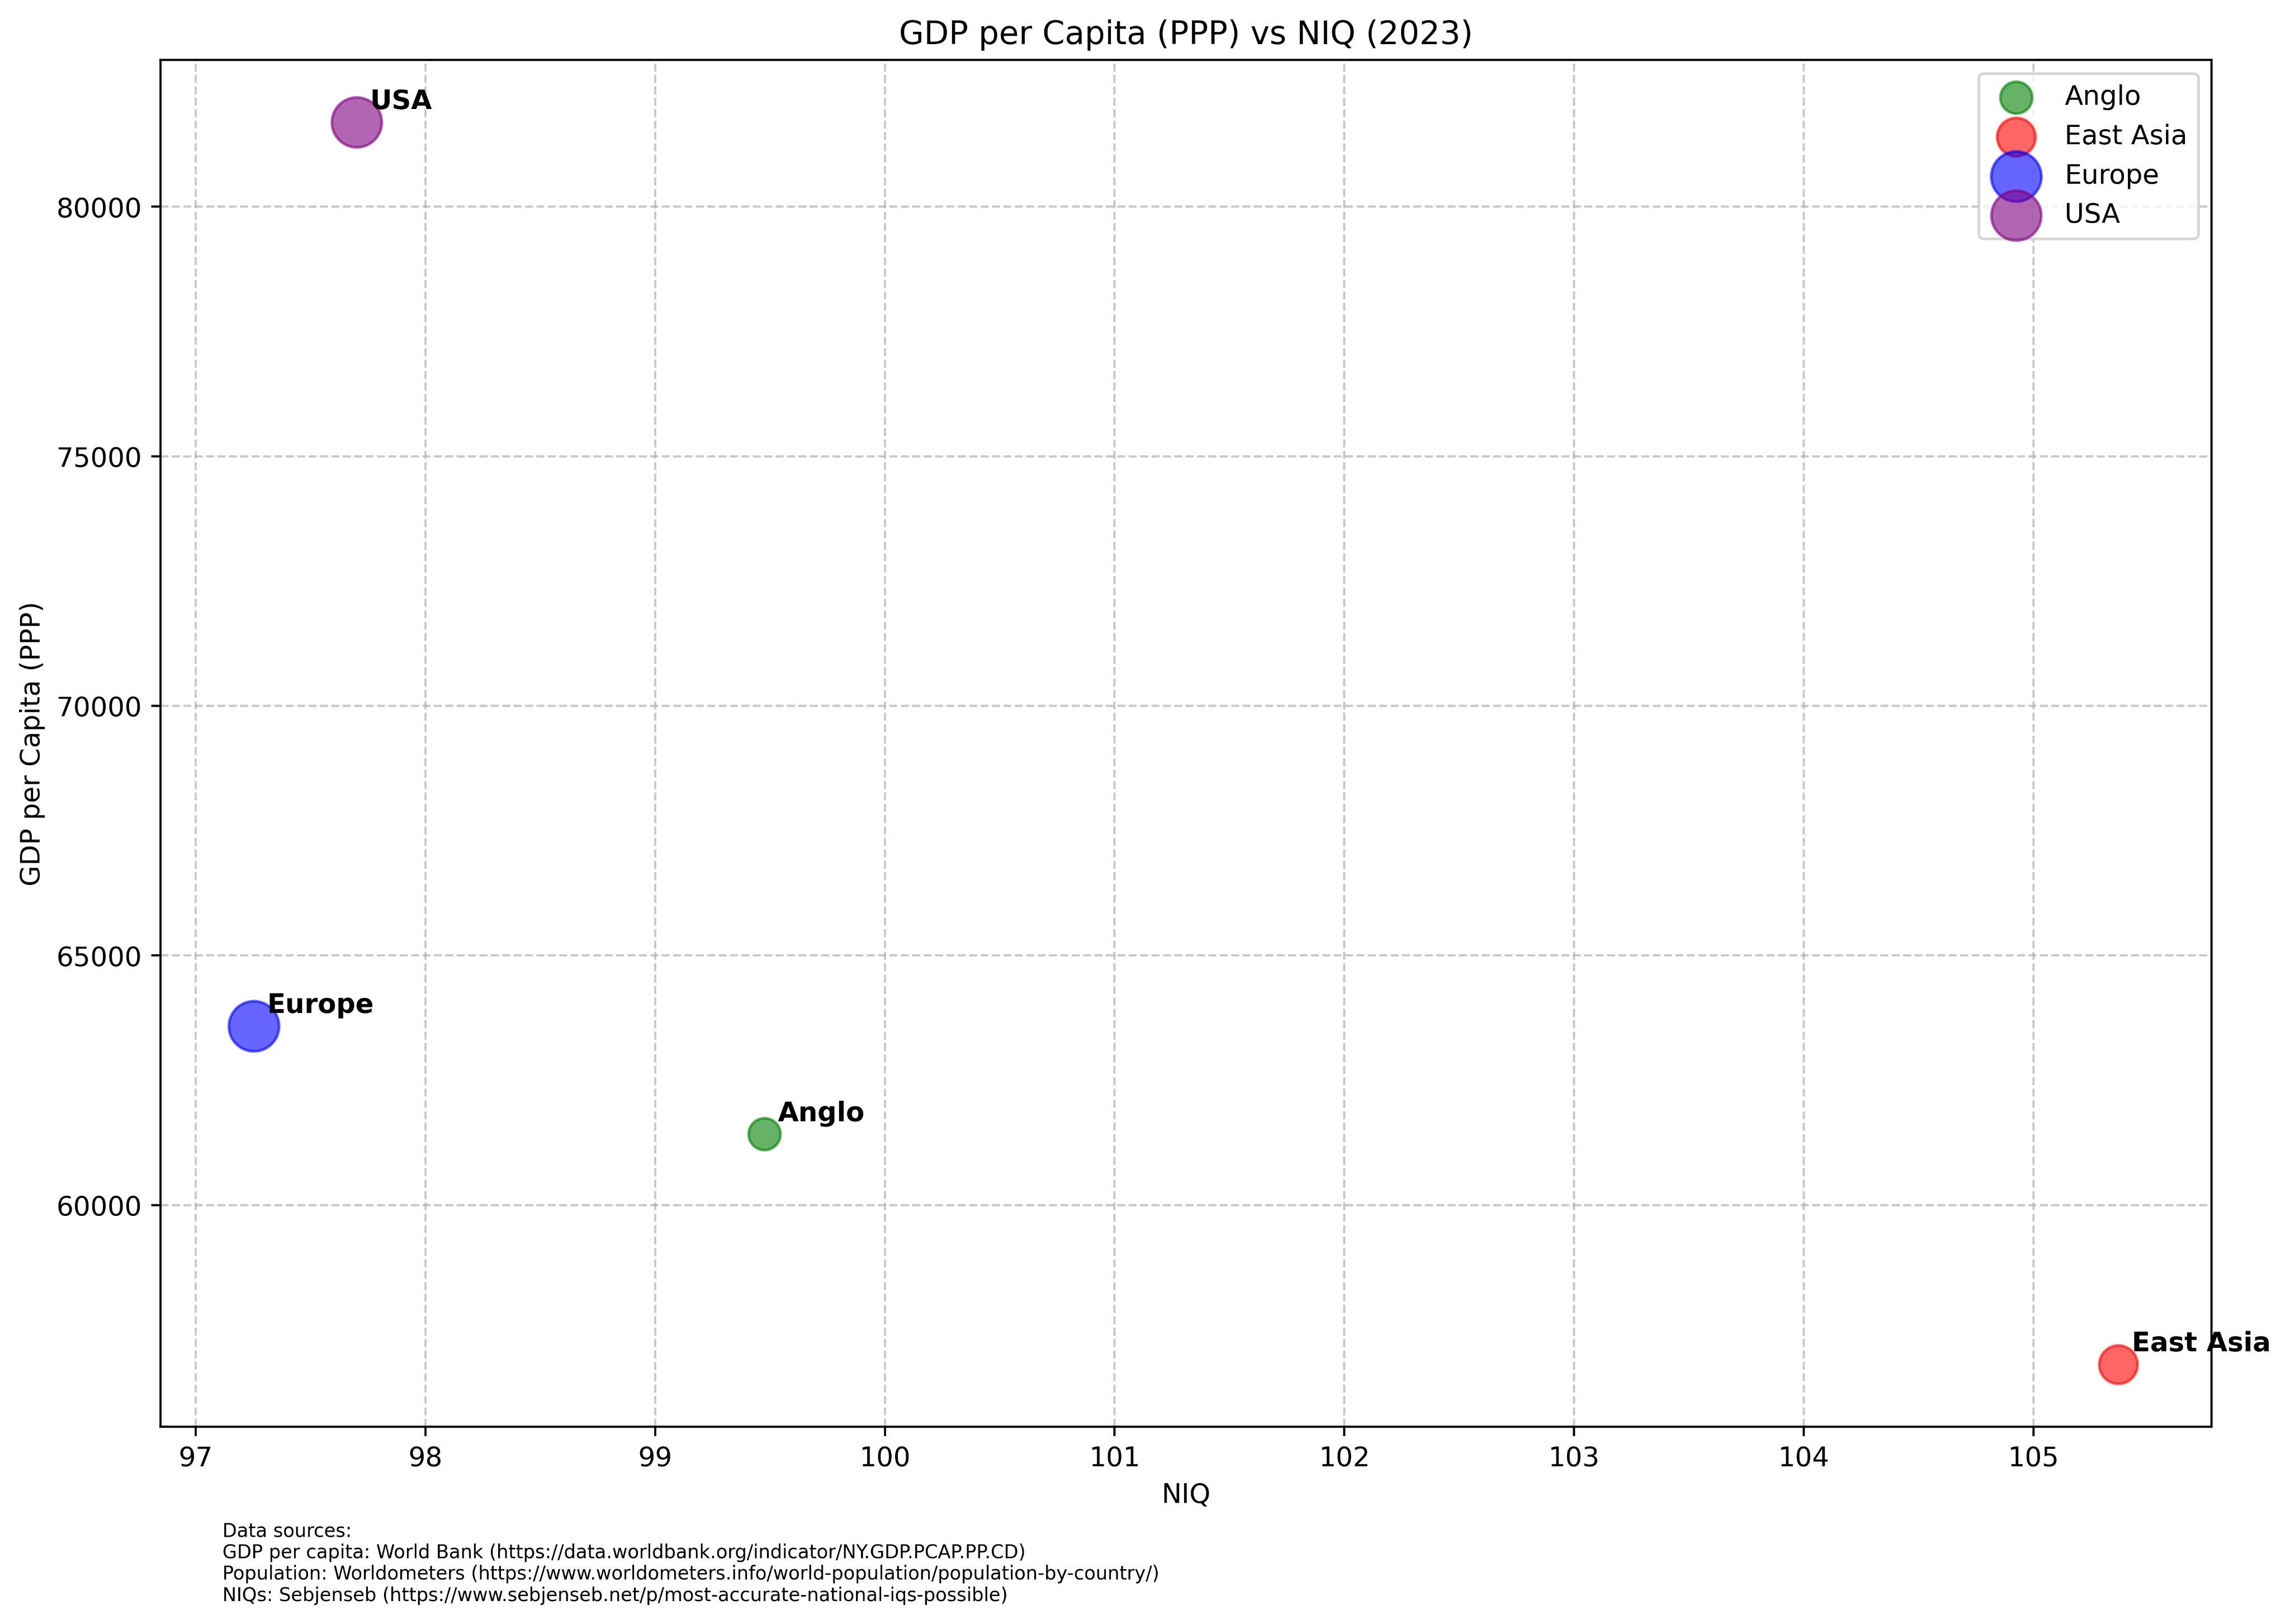
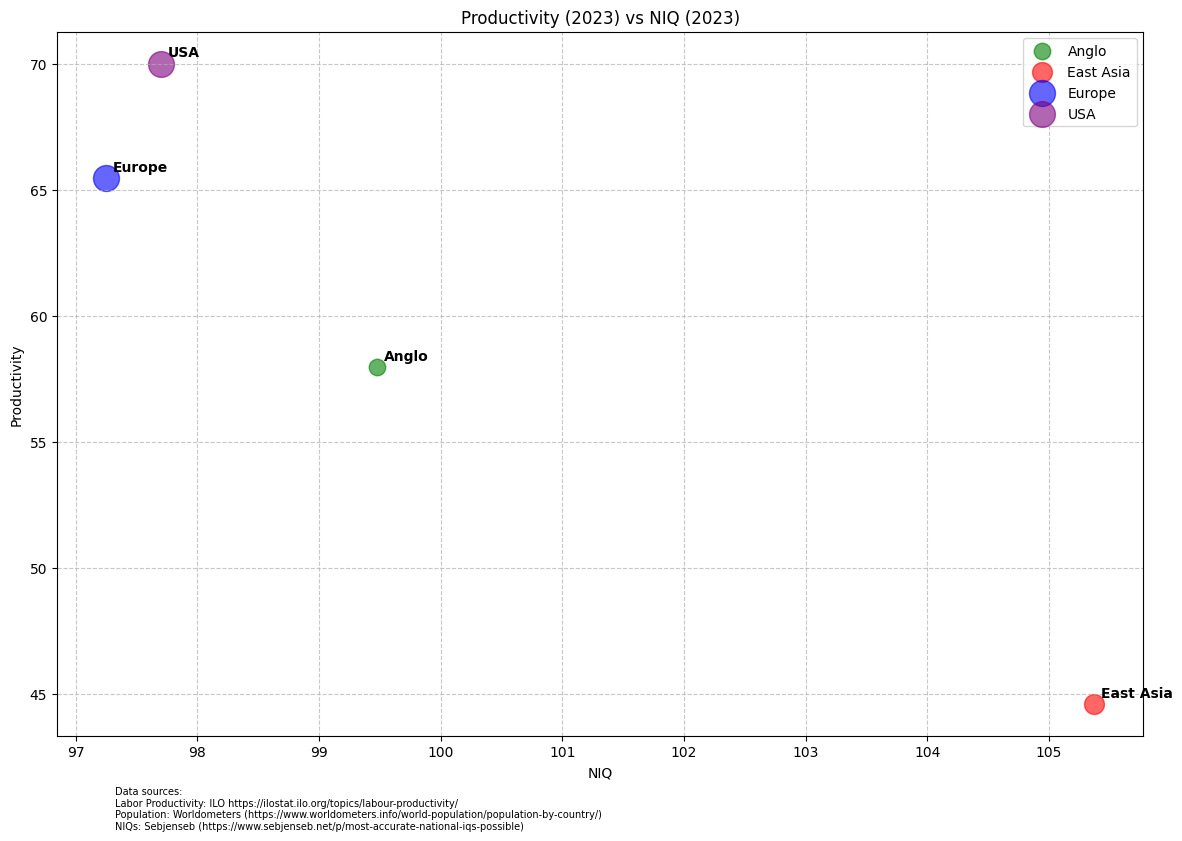
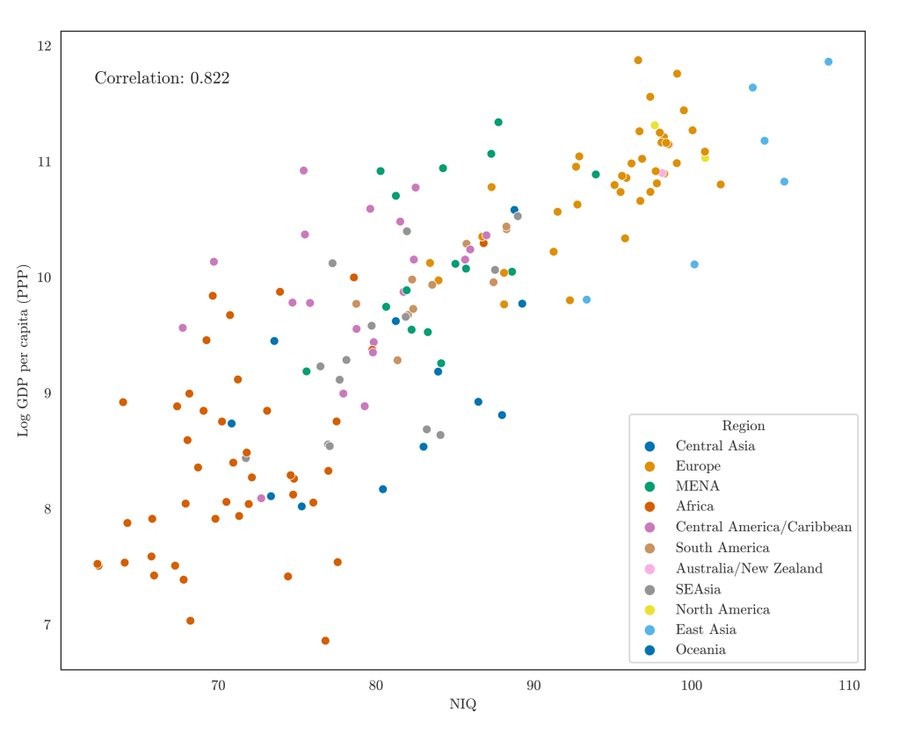
This idea also comes from Anatoly Karlin. Setting a handful of tax havens/tiny tourism countries/petrostates aside and accounting for the effects of Communism, IQ is the strongest predictor of development. But East Asian countries are notably poorer than would be expected based on the IQ/development relationship seen in majority-white countries. I updated his 2015 charts to more recent data below. You can see that, even with range restriction, there is a strong positive correlation between national IQ and GDP per capita at the country level.
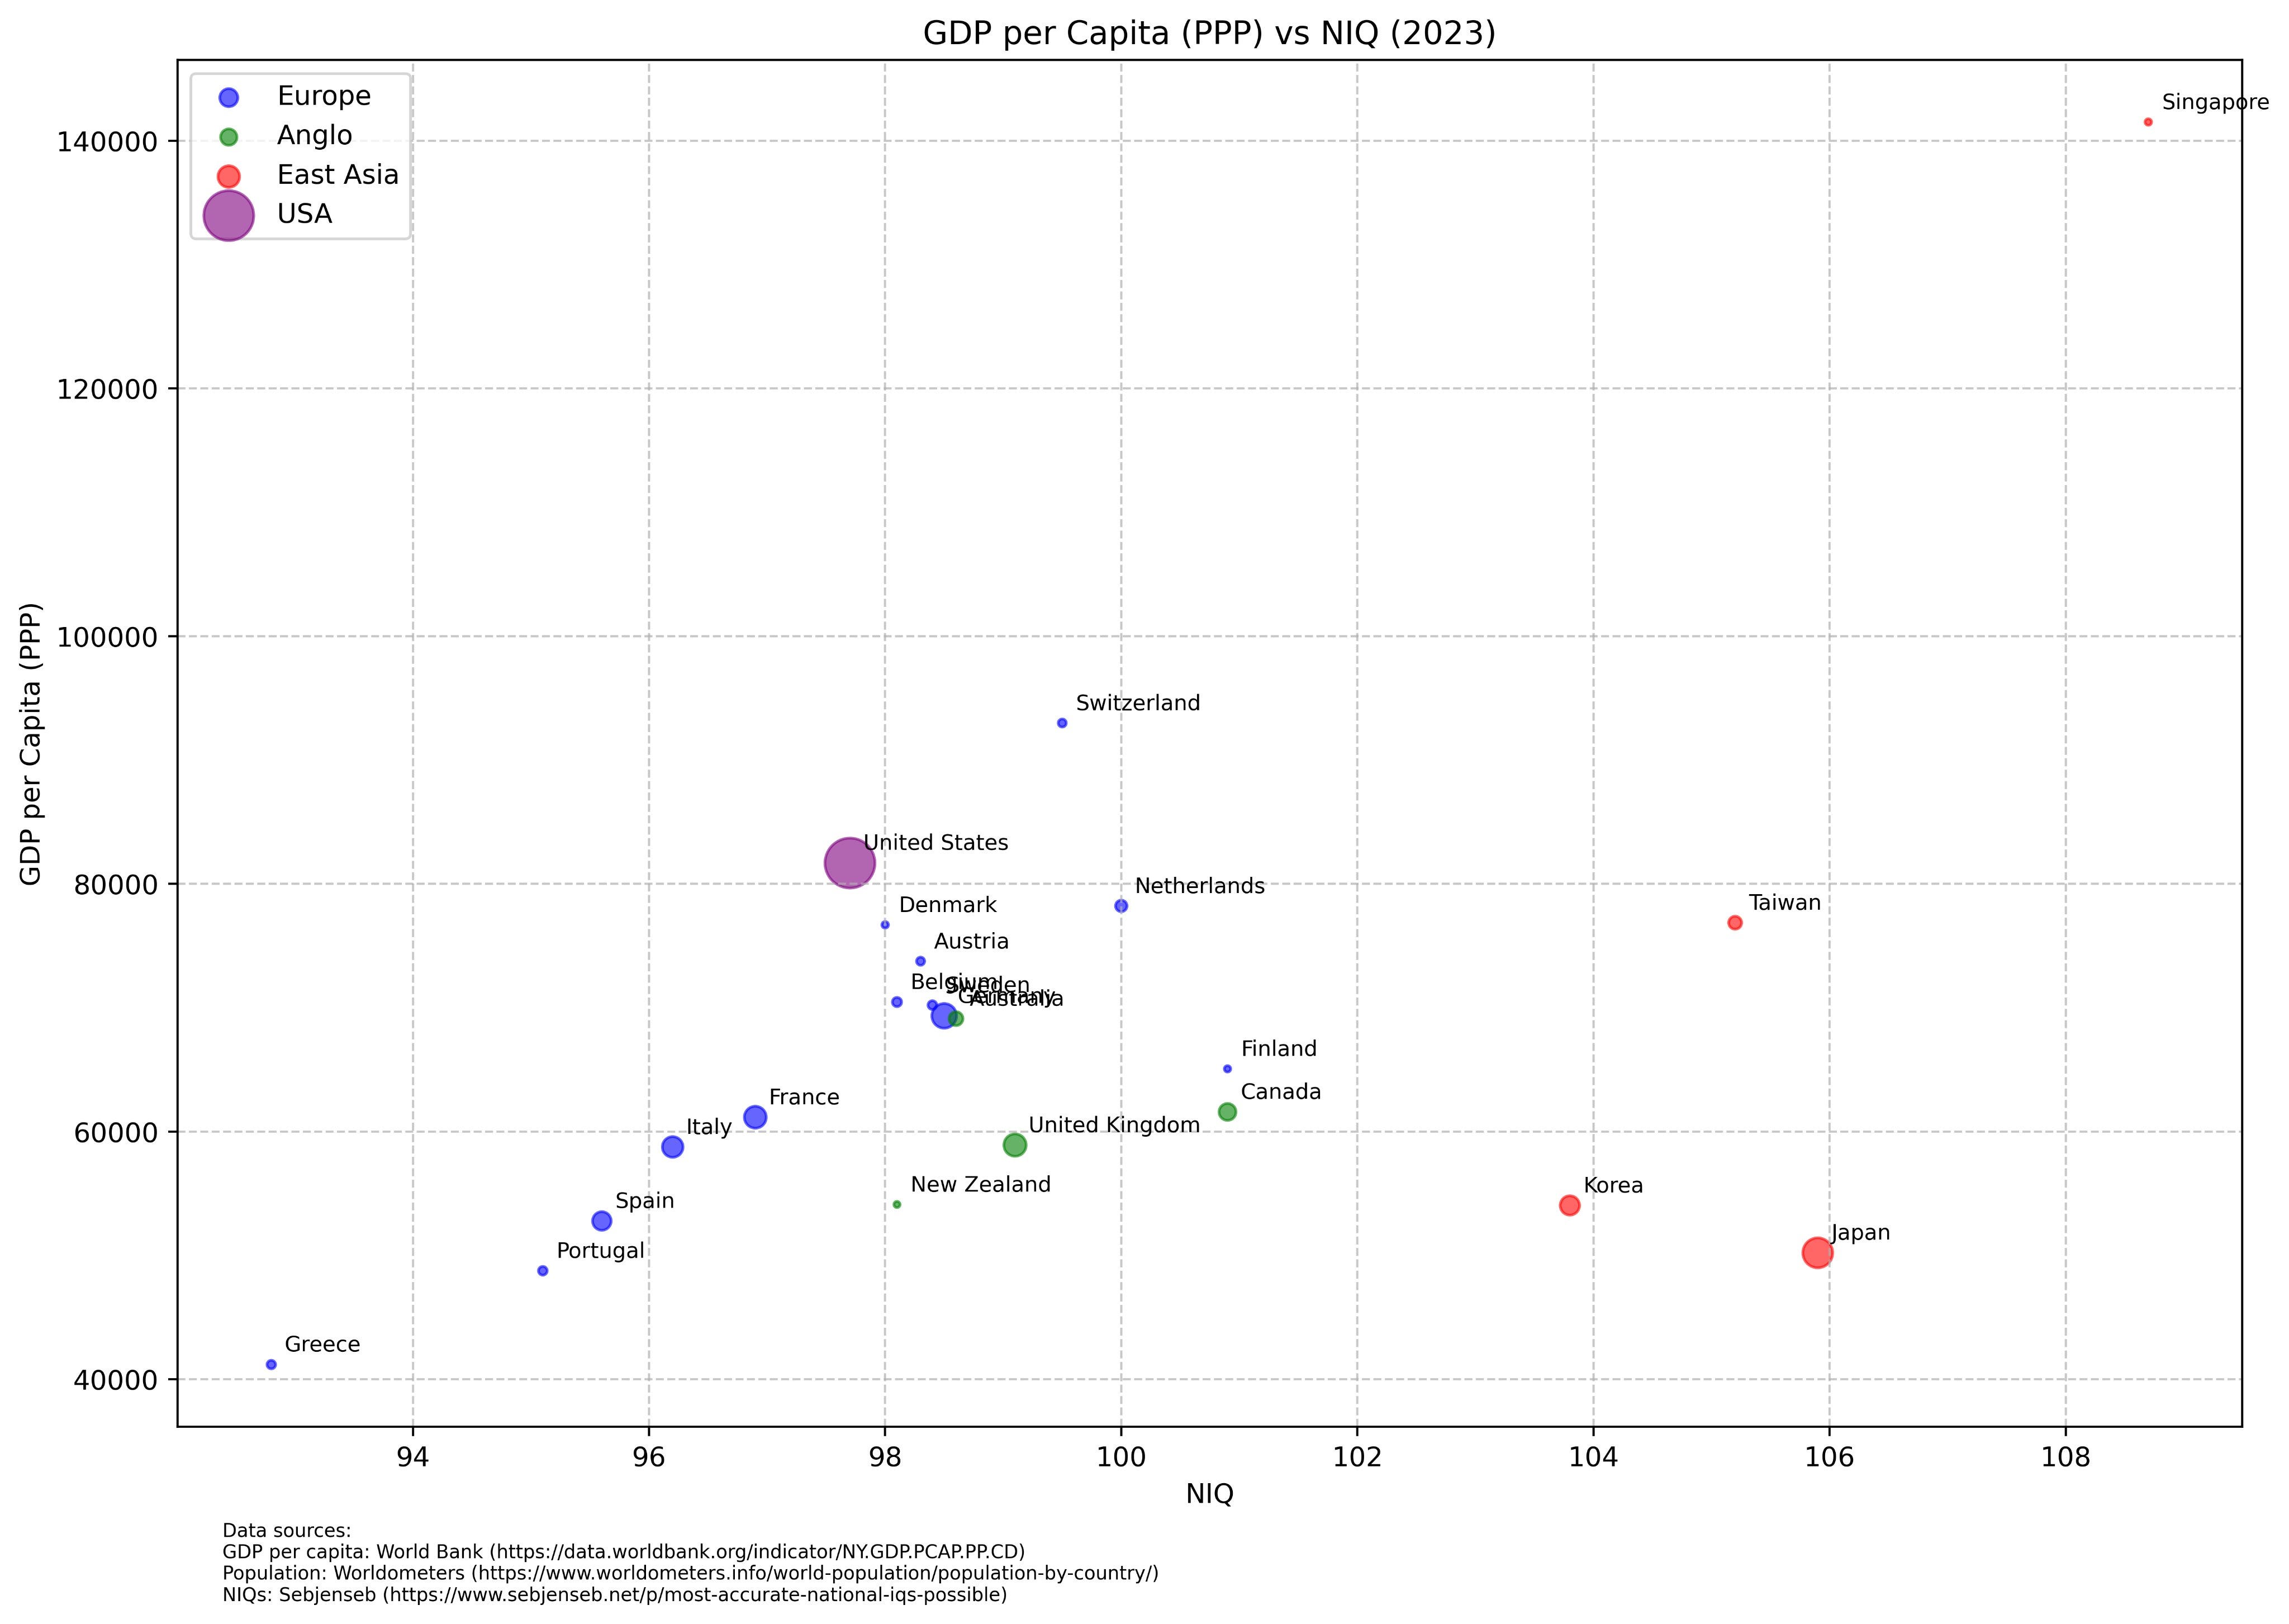
Regionally, the USA strongly outperforms, while the Anglosphere and especially East Asia underperform.
Some of this is due to working hour differences. Whether throughput or efficiency should be seen as more important depends, and leisure/labor is a tradeoff, so it’s not clear that raw output per person is necessarily what’s important (though note that the marginal labor hour should be expected to be less productive than the mean, so achieving the same productivity at higher hours is still impressive). When looking at productivity rather than GDP per capita, the gradient from Greece through the Netherlands still pops out, but the US no longer outperforms.
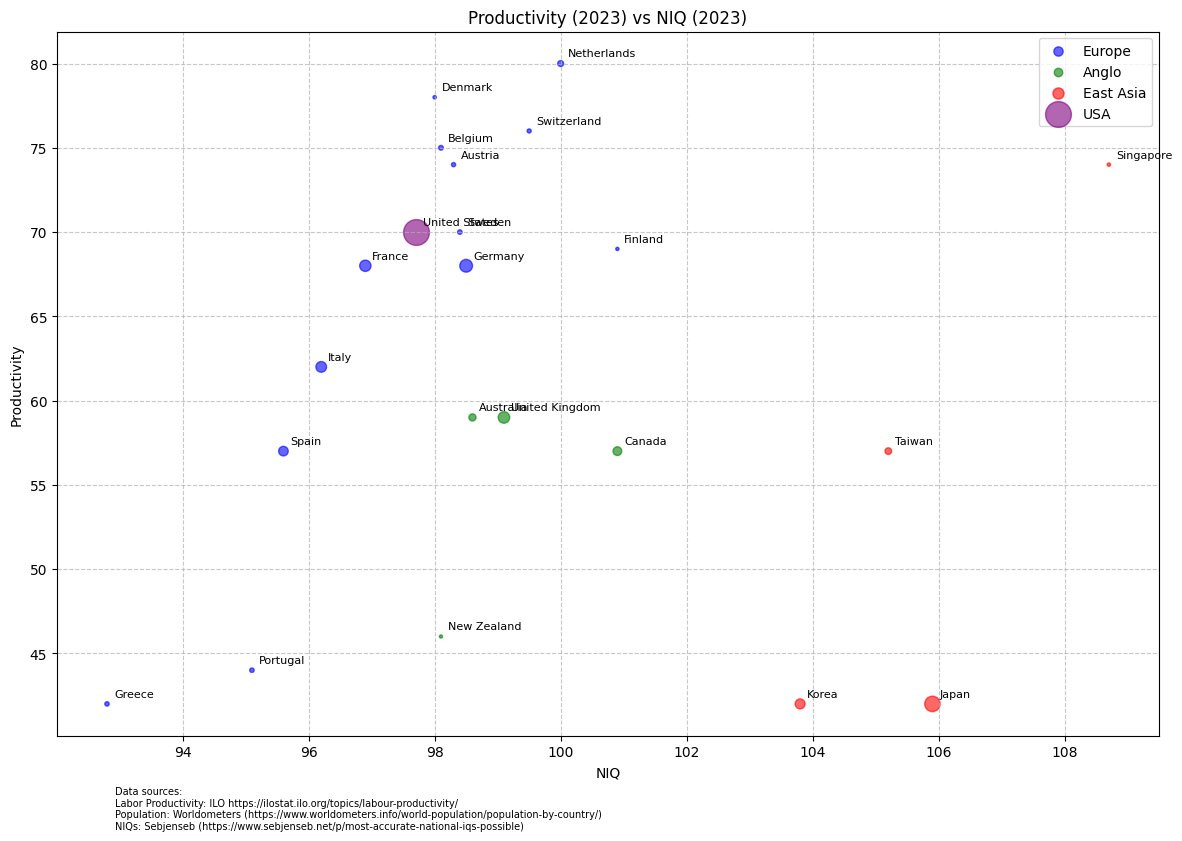
The US and Europe are almost indistinguishable here, but Anglosphere and especially East Asian underperformance are still notable, because both of these regions have longer working hours than their European counterparts.
This does not hold for the East Asian diaspora in the United States or Canada, which is approximately as successful as you’d guess based on IQ. One interpretation (which I do not claim is a fact) of this is that East Asians, like Ashkenazi Jews, are better as individuals working within systems built by Westerners than they are at collectively building those systems themselves. Another is that particular bad policies, like Anglosphere planning laws and Japanese retail laws, are so destructive to economic growth that they more than outweigh the IQ advantages of these places.
Clarkian Selection
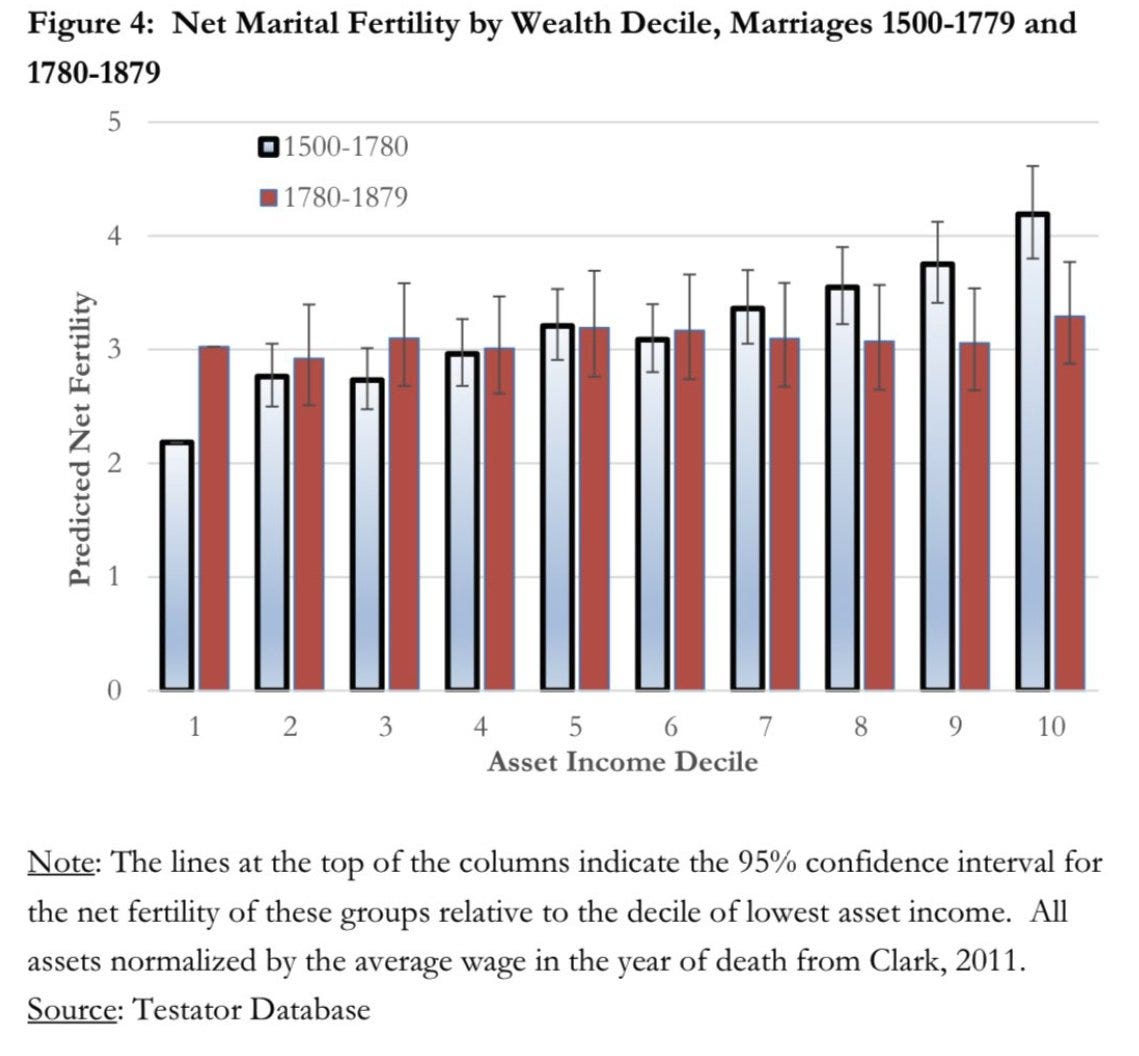
What I call Clarkian selection comes from the book A Farewell to Alms. The key chart is the below one, of the strong positive relationship between wealth and net fertility in early modern England. Combined with a stagnant population, the result was that the lower classes repeatedly went extinct (or rather, had descendants but a smaller and smaller fraction of the ancestry of future generations was from them) and were replaced by the downwardly-mobile scions of the middle class (not the aristocracy).
Clarkian selection is sometimes rounded to “survival of the richest,” but that’s not quite accurate. Early modern England had a few other relevant characteristics:
A market economy in which most producers are producing for a market, not just for their own households. Market success requires a different set of skills than substinence household production.
Weak extended kinship networks. This means market success depends more on one’s own abilities than one’s kin.
No caste system or middleman minorities. Clarkian selection requires downwards mobility to operate; India, with its millennia-old caste system, had virtually no social mobility at all and hence Clarkian selection must have been much weaker. Something similar applies to the endogamous middleman minorities common in most agrarian societies; if you’re in the Pale of Settlement and most trading and lending is done by Jews, then selection for traits based on success on these activities will be confined to the Jewish population and not spread to the population as a whole. Mutatis mutandis for Armenians and Greeks in the Ottoman Empire, Chinese in Southeast Asia, Germans in Eastern Europe, and so on. An ethnically homogenous population is important for Clarkian selection to operate at full strength.
A strong state that could prevent riches from being acquired via internal force or fraud. It’s notable that it was not the aristocracy, with its legal privileges originally gained via the battle-axe, that biologically expanded, unlike in Poland, but the medieval middle class. Selection for rent-seeking is a natural result of selection for wealth in many societies.
Clarkian selection is not just about IQ. Clark himself mostly focuses on time preference and impulsivity. It’s also not just genetic; it depends on familial inheritance of traits, but is mechanism-agnostic (though behavioral genetics suggests familial inheritance of traits is mostly genetic).
Cognitive Capitalism
Cognitive capitalism refers to the fact that national IQ is the best predictor of GDP per capita and (conditional on initial development level) economic growth. In fact, national IQ is a much better predictor of economic development than individual IQ is of personal income, a finding which inspired Garrett Jones to write the book Hive Mind. This is because, in addition to being generally more competent and skilled, smarter people are better at cooperating and support more pro-growth policies (on average).
The implications are obvious: making your country dumber, which immigration does almost everywhere, will make it poorer, on average. And because of regression towards the mean, in the long run your descendants will share the fate of your nation.
One caveat here is that this stylized fact is more true than it was when Richard Lynn first noticed this connection in the early 2000s (this is one of the reasons to believe causality goes more from IQ to wealth than the other way around). This is because it takes generations to exit the Malthusian Trap (where better tech and competence do not lead to higher living standards) and because bad social organization, like Communism, can and does make competent populations massively poorer. The fact that the relationship is so strong today is a function of homogenization on market norms and the fact that it’s been centuries since the Industrial Revolution; it would not have held in 1500.
Incentives vs Selection
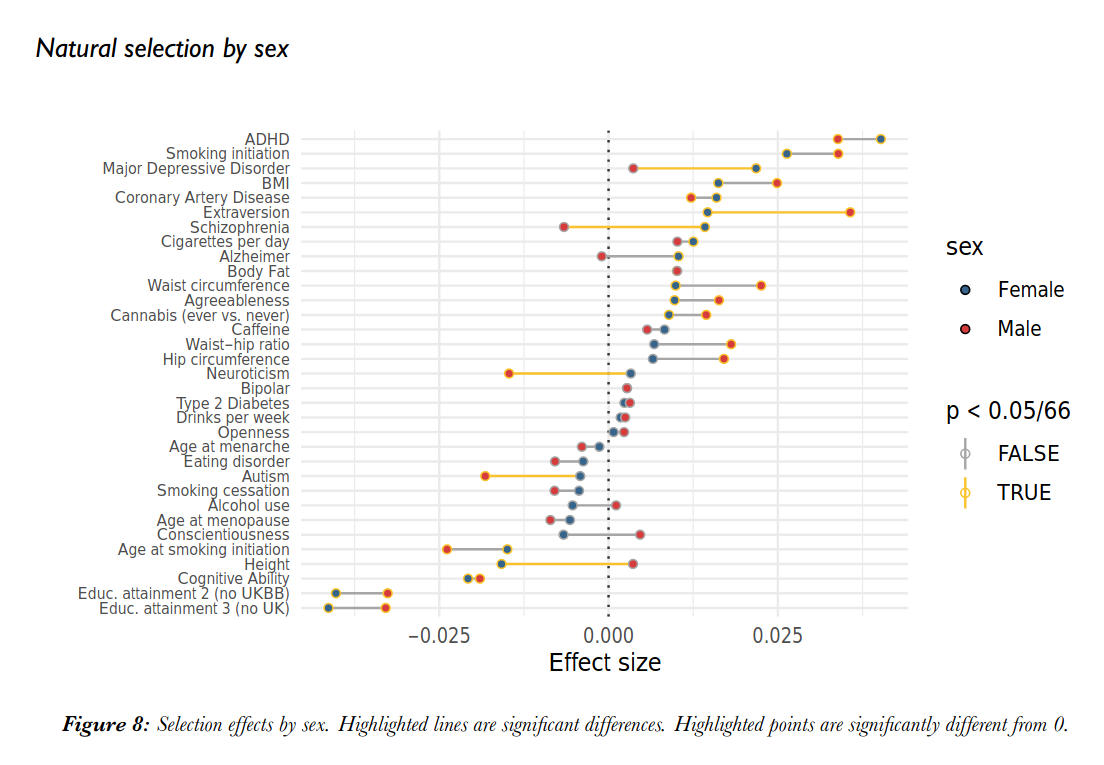
These are often confused in pop-HBD discourse. In the long run, selection changes what incentivizes people, but at any given point these two can diverge massively. For instance, on X I regularly see claims that obesity is getting selected out of the gene pool because it is unattractive, but that’s not true.
Other
Net vs Gross Fertility
TFR is a very useful statistic, but pre-WWII TFRs can be extremely misleading about fertility because infant and child mortality was so high. This can lead to fatalism about the inevitability of fertility decline and (wrong) theories of everything. I made this point in my original article on the Baby Boom, which is that far from being a blip compared to the centuries-long TFR decline before it, the Boom was a huge deal even on longer time scales.

Comparing unadjusted TFRs across time has one other limitation too (aside from the obvious that all vital statistics get less reliable the further back in time and the further away from Britain and Scandinavia you go). TFR is calculated by taking the age-specific birth rates of women in a given society at a given point time, and constructing a “synthetic woman” that experiences those birth rates throughout her lifetime. While virtually all women live through childbearing age today, this was not always true, which inflates past fertility. In general, women shifting from one category to another (in this case, from alive to dead) during childbearing years can lead to misinterpretations of category-specific TFRs (such as TFR by education or marital status). These category-specific TFRs are still handy, but should not be used unless you understand what TFR is and how it’s calculated.
Immigrant Alignment
This one’s very simple. Immigrants are people with agency. They are not meat machines. Judging the effects of immigration by looking solely at the equilibrium effects on the labor market (under idealized conditions) or their scientific, technological, and entrepreneurial achievements is suicidally blind. They have their own beliefs about how things should be run, their own political cultures, and, by default, their own ethnic and national loyalties distinct from yours. An ideologically deranged or ethnically hostile foreign elite is exceptionally dangerous, and if you lose control over your institutions to a cohesive ethnic clique, there’s no way to get it back. You are disempowered for good barring system collapse. See: The Case Against Indian Immigration, Riding the Tiger, and Increasing Skilled Immigration is a Mistake. This phrasing comes directly from AI discourse.
Nonlinear Ethnic Niche
This term comes from a 1999 New York Times article titled A Patel Motel Cartel?
“America's motels constitute what could be called a nonlinear ethnic niche: a certain ethnic group becomes entrenched in a clearly identifiable economic sector, working at jobs for which it has no evident cultural, geographical or even racial affinity.
I don't mean Italians owning pizzerias, or Japanese people running judo schools. I mean, to use an obvious example, the Korean dominance of the deli-and-grocery sector in New York -- a city where the Chinese run most laundries and Sri Lankans, in case you didn't know this, run most porn-video stores. Or the Arabs in greater Detroit, who have a stranglehold on gas stations, or the Vietnamese who monopolize nail salons in Los Angeles. Farther afield, I could mention London's taxi drivers, sharp-tongued in their big black cars, many of whom are Jews from the city's East End; or the security guards outside New Delhi's more affluent residences, virtually all of whom are Nepalese; or the prostitutes in the United Arab Emirates, who are so often women from Russia.”
The key characteristics of a nonlinear ethnic niche are:
Total domination of a small sector of the economy (say, gas stations in Detroit), usually, but not always, ownership of some particular type of small business.
No particular affinity on an individual level for this sector on the part of the ethnic group; Patels do not have motels in their blood.
Typically sustained through below-market-rate ethnic network loans and exploitation of immigration systems to keep costs below those of non-network competitors.
These are something of a halfway house between a caste and a vocation.
Signaling Theory of Education
The labor market benefits of education are (mostly, around 80%) because education is a signal of underlying productive traits. This implies that increasing individual investment in education is often rational, but leads to a signaling spiral in which more and more of people’s life and money are consumed by a negative-sum arms race. The main reader on this is The Case Against Education. See also: Norman Angleson’s review of The Case Against Education, The Education Realist’s four-part critique, and my argument about how this applies to the “cultures that value education” beloved of conservatives.
The Economist’s Fallacy
What I call the economist’s fallacy is the tendency for economists to “assume the system”; that is, the implicit belief that the political stability, market norms, and so on of society are roughly constant. History shows the ridiculousness of this assumption; everywhere on Earth outside the Anglosphere and the smaller countries of northern Europe (not France or Germany) has had at least one and usually more than one major system break since 1900. This is particularly bad in immigration discourse, where economists tend to treat immigrants as labor (and maybe brains) within the system rather than people who can shape society themselves, but applies to a lesser degree to trade too (the second globalization depended on American power while seriously undermining it by empowering the PRC).
There's certainly gross dysfunction in East Asia but they were always less developed than Europe and have been playing catch-up the whole time. Japan - razed in the war (much less of a baby boom than Anglosphere), very little resources. Korea, razed in the war, very little resources.
China makes up the bulk of East Asia and they're not done developing yet. How can they have high GDP when their capital base has only just started to pay dividends and they're still building it out?
Admittedly Germany is also resource-poor and was razed yet recovered very quickly, to a higher level compared to Japan. So not unreasonable for some kind of Europe-Asia gap but a much smaller gap than from GDP alone. Anglosphere countries have high resources/capita and were never razed, US especially enjoyed various privileges.
Very small quibble--Chinese astronomers were aware the Earth was spherical, and made astronomical calculations with that assumption in mind. The fact that this knowledge did not propagate to cartographers is more evidence of the lack of communication between ancient Chinese fields of science, rather than a complete lack of knowledge.